I am a statistician and I buy lottery tickets
 DC Woods on
 When my friends hear me say that I’m buying a lottery ticket for a big draw I often get the comment, “but aren’t you a statistician?”. The implication is that only people who are ignorant of probability would play the lottery. I’ve also heard the belief that the lottery is a tax on poor people. I have a different view, that buying lottery tickets is perfectly rational for me.
There are a number of different lotteries here in Melbourne, Australia, but lets consider the draw for this Tuesday, the “Super 7’s Oz Lotto”. This game draws seven balls from 45, and the big “first division” prize is for getting all seven correct. There are six other consolation divisions with much smaller prizes for getting a smaller number of balls correct. The first division prize for this week is $70 million, which is quite a bit bigger than usual.
The odds against winning the big prize are 45,379,619:1.1 That sounds like a long shot by any measure, and this is the number that people usually quote when they tell you how crazy you are. However, that is the odds for a single combination of balls - one line. Usually you’d buy a ticket with multiple lines. For a standard 12 line ticket the odds shorten to 3,781,635:1, still not very likely, but definitely much improved. I actually got excited by the big draw this week and bought a 36 line ticket, for odds of 1,260,545:1, just over “one in a million” odds.
The standard argument of people who think that lotto is for suckers is based on expected return. They are taught at school that a rational investment is one with an expected value greater than the price paid. I have some problems with this argument, but I’ve never really calculated it before, so let us consider the numbers. Each line on the ticket costs $1.20, so a 12 line ticket costs $14.40. The way we calculate expected return is to multiply the payout times the probability:
Expected return per line = $70,000,000 / 45,379,620 = $1.54
Hang on, each line costs us $1.20 and has an expected value of $1.54… that sounds like a good investment! In fact, it could be tempting to buy every single combination of numbers to guarantee a win, with a cost of $54,455,545, and a profit of $15,544,455.2
Unfortunately, there is another factor to consider. We only get the full prize if we win it alone. If another person also has the winning combination we get half, only $35m, and if three or more people win then we get a correspondingly smaller fraction of the prize. To calculate the true expected value of our ticket we need to estimate the probability distribution of the number of winners. This requires us to know the number of tickets sold. It turns out we can get an estimate of this, but we have to do some work.
The table below shows the results from the $50m draw last week. Note that the first division prize wasn’t won so it jackpots to this week.
| Division | Prize per winner | Division prize pool | Winners | Odds | Estimated lines sold |
|---|---|---|---|---|---|
| 1 | - | - | - | 45,379,619:1 | - |
| 2 | $34,346.25 | $721,271 | 21 | 3,241,400:1 | 68,069,430 |
| 3 | $4,759.50 | $1,484,964 | 312 | 180,077:1 | 56,184,291 |
| 4 | $366.45 | $763,681 | 2,084 | 29,601:1 | 61,690,234 |
| 5 | $49.05 | $890,600 | 18,157 | 3,429:1 | 62,279,498 |
| 6 | $24.00 | $10,185,408 | 424,392 | 153:1 | 65,226,403 |
| 7 | $14.55 | $11,398,484 | 783,401 | 86:1 | 68,123,866 |
The odds allow us to calculate the probability of winning each division. Since we know the number of lines that actually won each division, we can estimate the number of lines sold.3 This is obviously probabilistic, so the estimates are different, but the division 7 estimate should be the most accurate.
We would expect the number of lines sold to be related to the advertised first division prize. This is the headline prize that is featured on TV and posters around town. Last week’s advertised prize was $50m. We can search to find the above table for past draws, and we can go back through the lottery’s twitter feed to find the advertised first division prize.4 The graph below shows the headline prize vs estimated lines sold (using the division 7 winners) for the past 52 draws. Also included on the graph is the biggest draw ever, $100m on 30 June 2009.
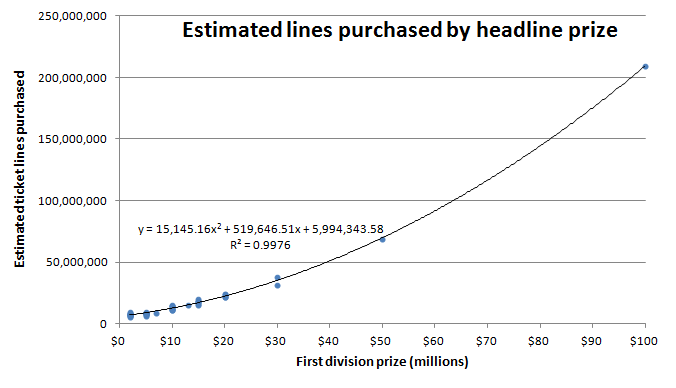
We can use the built-in functionality in Excel to fit a quadratic curve to the data. With an R-Square value of 99.76%, the curve seems to fit the data well. By plugging $70m into this equation, we can estimate that approximately 116,580,883 lines will be sold in the upcoming draw. We can now use this to calculate the probability of winning the first division alone, or having one, two, or more other winners.
The following formula gives us the probability of having X winners, where the number of lines sold is N, and the probability per line is p.
P(X) = NCX * pX * (1-p)N-X
By plugging in the values of N = 116,580,883 and p = 1 / 45,379,620 we can calculate the probability for all values of X. The table below shows this for X between 0 and 11.
| Winners | Probability | Cumulative | Share of prize | Prob, given a win | Expected return |
|---|---|---|---|---|---|
| 0 | 7.66% | 7.66% | $0 | ||
| 1 | 19.68% | 27.34% | $70,000,000 | 21.31% | $14,920,082 |
| 2 | 25.28% | 52.62% | $35,000,000 | 27.38% | $9,582,475 |
| 3 | 21.65% | 74.27% | $23,333,333 | 23.45% | $5,470,559 |
| 4 | 13.90% | 88.18% | $17,500,000 | 15.06% | $2,635,114 |
| 5 | 7.14% | 95.32% | $14,000,000 | 7.74% | $1,083,143 |
| 6 | 3.06% | 98.38% | $11,666,667 | 3.31% | $386,474 |
| 7 | 1.12% | 99.50% | $10,000,000 | 1.22% | $121,574 |
| 8 | 0.36% | 99.86% | $8,750,000 | 0.39% | $34,161 |
| 9 | 0.10% | 99.97% | $7,777,778 | 0.11% | $8,668 |
| 10 | 0.03% | 99.99% | $7,000,000 | 0.03% | $2,004 |
| 11 | 0.01% | 100.00% | $6,363,636 | 0.01% | $425 |
The 5th and 6th columns are what we are interested in. We are trying to determine the expected returns, given that we have won. The probabilities are calculated using the following formula.
P(X | X > 0) = P(X) / (1 - P(0))
To find the expected return if we win first division we then sum the values in the right-hand column, to give $34,244,780. Multiplying this by p gives an expected value of each line of $0.75. So, rationally, we shouldn’t invest in tickets for this lottery, since 0.75 < 1.20.
However, there is another factor to consider. We have calculated the expected return for winning first division, however we also have a chance of winning the other divisions. We also need to calculate how much we can expect to win for each of the other divisions.
116,580,883 lines at $1.20 per line gives a total amount paid of $139,897,060. The game rules state that at least 55% of this total must be used in the prize pool, and analysis of results from the past year confirms this figure.5 This gives a prize pool of $76,943,383. The game odds page also gives the proportion of the prize pool that is allocated to each division. Using the odds we can then determine the expected number of winners and the payout per winning line. The table below shows the expected value of a line for each division:
| Division | Proportion of pool | Division prize pool | Odds | Expected winners | Prize per winner | Expected return |
|---|---|---|---|---|---|---|
| 2 | 1.70% | $1,308,038 | 3,241,400:1 | 36 | $36,368.52 | $0.0112 |
| 3 | 3.50% | $2,693,018 | 180,077:1 | 683 | $3,940.86 | $0.0231 |
| 4 | 1.80% | $1,384,981 | 29,601:1 | 3,938 | $351.67 | $0.0119 |
| 5 | 2.10% | $1,615,811 | 3,429:1 | 37,926 | $42.60 | $0.0139 |
| 6 | 24.00% | $18,466,412 | 153:1 | 758,527 | $24.35 | $0.1584 |
| 7 | 26.90% | $20,697,770 | 86:1 | 1,340,640 | $15.44 | $0.1775 |
Adding up the values in the expected return column gives an expected return of $0.40 for divisions 2 to 7. Added to the expected return from division 1 gives an expected value per line of $0.75 + $0.40 = $1.15. This is still less than the $1.20 we paid, but not by too much.
However, even if the expected value of a ticket was positive, it would still be a terrible investment. The expected value argument only really works in the long term - if I was investing in millions of lines of tickets, or millions of different draws, then in the long run I would expect to make money. This is how casinos work: very small positive expected returns multiplied by millions of transactions. For an individual though, the probability of winning is essentially zero. We don’t get to perform millions of transactions so we are almost certainly going to lose our “investment”.
So why do I still buy lottery tickets? Definitely not for the expected monetary return on investment. I think of it as a discretionary entertainment spend. I get literally hours of enjoyment from fantasizing what I’d do if I won. I happily spend $25 for two hours of entertainment at the movies, and I don’t judge the value of that experience based on its expected return. For me, a lottery ticket for the occasional big draw has just as much entertainment value, or more, than the many other things that I spend money on to entertain myself.
The decision of whether to buy a lottery ticket shouldn’t be based on the probability of winning, or the expected return of a ticket, but on the entertainment value that comes from imagining a different life. If that entertainment value compares favourably with other activities with a similar price, then go for it. Plus, it has the added bonus that you might actually win; one-in-a-million events happen every day. Someone eventually wins the big prize, and you have to be in to win.
If you liked this, I’m @dcwoods on Twitter
-
The odds on the website are reported incorrectly. 1 in 87 is actually 86:1, not 87:1. ↩
-
Buying so many tickets would be a major logistical challenge. ↩
-
Estimated lines sold = winners in division / probability of winning division. ↩
-
The actual first division prize may be more than the advertised headline prize, depending on ticket sales. ↩
-
The total prizes paid can be more than the prize pool, since jackpots are added on top to the first division. ↩